photo of Lace Padilla

Lace Padilla

CV · · · · Mastodon
l.padilla [at] northeastern.edu
Teaching
  • Information Visualization Theory and Application (Fall 23)
  • Global Good Studio: Data Visualization (SP 20, Fall 21-22)
  • Judgement and Decision Making (SP 20, SP 21, Fall 21-22)

Research Projects

Below are my core research directions. I also collaborate on projects broadly associated with cognition and data visualization. You can find more details on our lab webpage.


Improving Decisions Using Visualizations of Uncertainty

While effectively communicating uncertainty is challenging, my collaborators and I have developed and tested several cognitively optimized visualization techniques, including forecasts of hurricanes and COVID-19 mortality prediction. These techniques capitalize on human decision-making capabilities and advances in uncertainty communication to help the public make more informed decisions during hazardous events.

photo of COVID-19 forecasts with using a line chart where each line shows one forecast

A multiple forecast visualizations (MFVs), is a type of chart where uncertainty is encoded implicitly through the disagreement (or lack thereof) of multiple forecasts plotted in the same space, which informs readers about the range, shape, and concentration of predictions. We have examined MFVs in the context of COVID-19 forecast visualizations.

VIS 2022 (Best Paper Award: Top 1%): Multiple Forecast Visualizations (MFVs): Trade-offs in Trust and Performance in Multiple COVID-19 Forecast Visualizations.
Padilla, L., Fygenson, R., Castro, S., Bertini, E.
PDF | Data + Analysis | Pre-registration

Impact of COVID-19 forecast visualizations on pandemic risk perceptions.
Padilla, L., Hosseinpour, H., Fygenson, R., Howell, J., Chunara, R., and Bertini, E.
Nature's Scientific Reports, 2022. PDF | Data + Analysis

Mapping the Landscape of COVID-19 Crisis Visualizations
Zhang, Y., Sun, Y.,Padilla, L.., Barua, S., Bertini, E., & Parker, A. G. PDF

Ensemble hurricane forecast with lines show pulls from a distribution on the left and the cone of uncertainty produced by National Hurricane Center on the right

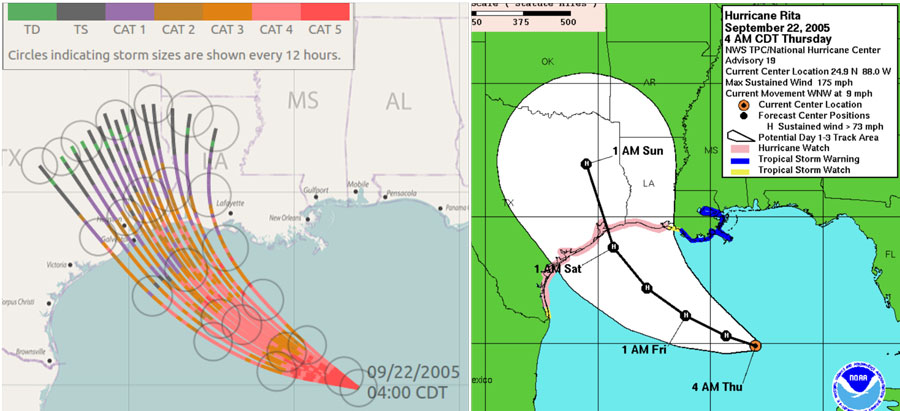
We have extensively examined is the Cone of Uncertainty produced by the National Hurricane Center, finding that people see the boundaries of the cone as encompassing a categorical danger zone, leading them to incorrectly think that areas outside the boundary are safe, whereas areas within the boundary are uniformly high risk. People also incorrectly think the cone shows the storm growing in size. The ensemble forecast on the left reduces these biases.

APA Early Career Award: Top 1%: The Powerful Influence of Marks: Visual and Knowledge-Driven Processing in Hurricane Track Displays.
Padilla, L.., Creem-Regehr, S. H., & Thompson, W.
Journal of Experimental Psychology: Applied, 2020.
PDF | Data + Analysis

Using Behavioral Insights to Improve Disaster Preparedness, Early Warning and Response Mechanisms in Haiti (English)
Llopis Abella, J., Perge, B,. Afif, Z., Soto O.,, Ruth, C., Padilla, L, Hsu, J.
PDF

Visualizing uncertain tropical cyclone predictions using representative samples from ensembles of forecast tracks
Liu, L., Padilla, L., Creem-Regehr, S. H., & House, D. H.
PDF | Visualization Technique Code | Data + Analysis

Effects of Ensemble and Summary Displays on Interpretations of Geospatial Uncertainty Data
Padilla, L., Ruginski, I., Creem-Regehr, S. H.
Cognitive Research: Principles and Implications, 2017.
PDF | Data + Analysis

Uncertainty Visualization by Representative Sampling from Prediction Ensembles
Liu, L., Boone, A. P., Ruginski, I. T., Padilla, L., Hegarty, M., Creem-Regehr, S. H., & House, D. H.
PDF

Non-expert Interpretations of Hurricane Forecast Uncertainty Visualizations
Ruginski, I. T., Boone, A. P., Padilla, L., Liu, L., Heydari, N., Kramer, H. S., & Creem-Regehr, S. H.
Spatial Cognition & Computation, 2016.
PDF | Data


Visualization Decision-Making and Perception Theory

Model of the visualization decision making process

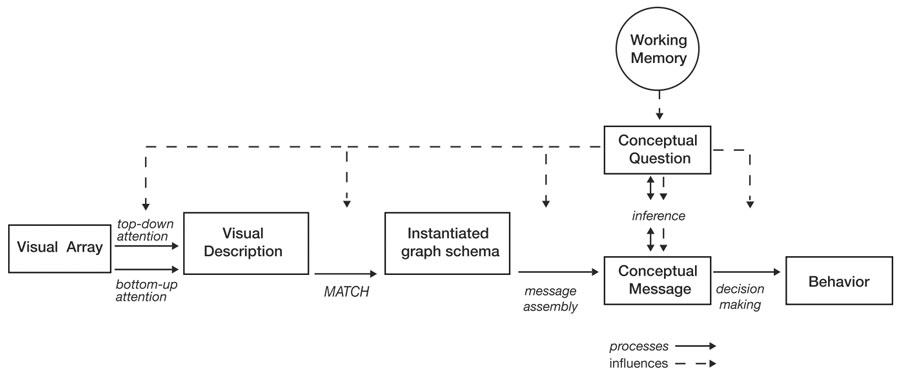
I developed the only modern decision-making model with visualizations that integrate current theories in visualization, cognitive, and decision-making sciences. This framework provides communicators with a grounding theory to address visualization-reasoning errors and develop new visualization techniques.

Decision Making with Visualizations: A Cognitive Framework Across Disciplines
Padilla, L., Creem-Regehr, S. H., Hegarty, M., & Stefanucci, J. K.
Cognitive Research: Principles and Implications, 2018. PDF

The Science of Visual Data Communication: What Works.
Franconeri, S. L., Padilla, L., Shah, P., Zacks, J. M., and Hullman, J.
Psychological Science in the Public Interest, 2021.
PDF

Cognitive Effort and Individual Differences in Data Visualization

Examining Effort in 1D Uncertainty Communication Using Individual Differences in Working Memory and NASA-TLX.
Castro, S. C., Hosseinpour, H., Quinan, P. S., & Padilla, L.
PDF | Data + Analysis

Toward objective evaluation of working memory in visualizations: A case study using pupillometry and a dual-task paradigm
Padilla, L., Castro, S. C., Quinan, P. S., Ruginski, I. T., & Creem-Regehr, S. H.
PDF | Data + Analysis